Trend widget tips
Be aware that some properties are only available when the Properties pane is in Advanced view.
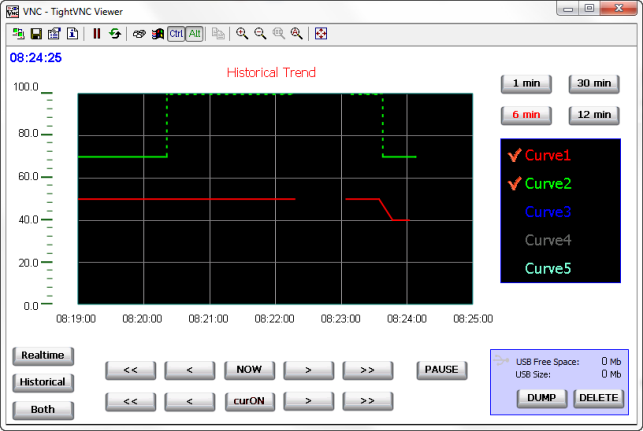
Values outside range or invalid
When trend value goes beyond the limits set for the trend widget, a dotted line is displayed. When the value of the tag is not available, for example the controller device is offline, no curve is drawn.
Showing trend values (cursor)
Trend cursor displays the trend value at a specific point.
Use the actions ShowTrendCursor and ScrollTrendCursor to enable the trend cursor and move it to the required point to get the value of the curve at that particular point in time.
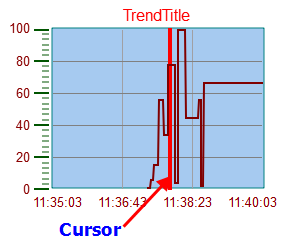
To display the value of the trend cursor on the page, define a numeric field and attach it to the Cursor Value widget tag.
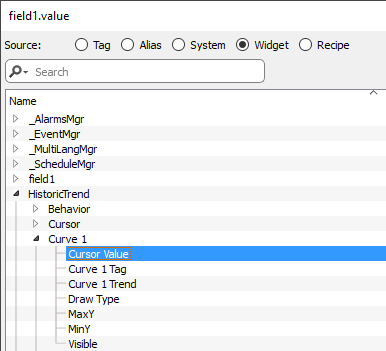
In this example the Y axis value of the cursor is displayed.
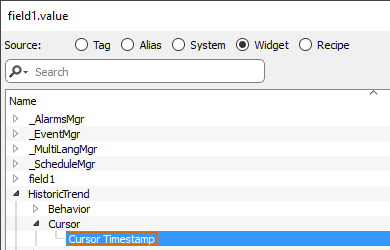
To display the trend time stamp at the position of the cursor, use a Time/Data widget (available inside Basic->Controls category) and attach the widget's value to the Cursor Timestamp property of the trend widget.
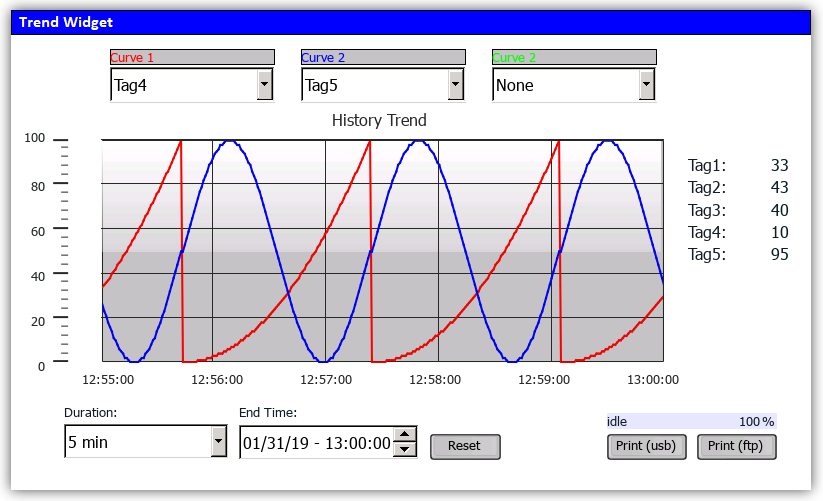
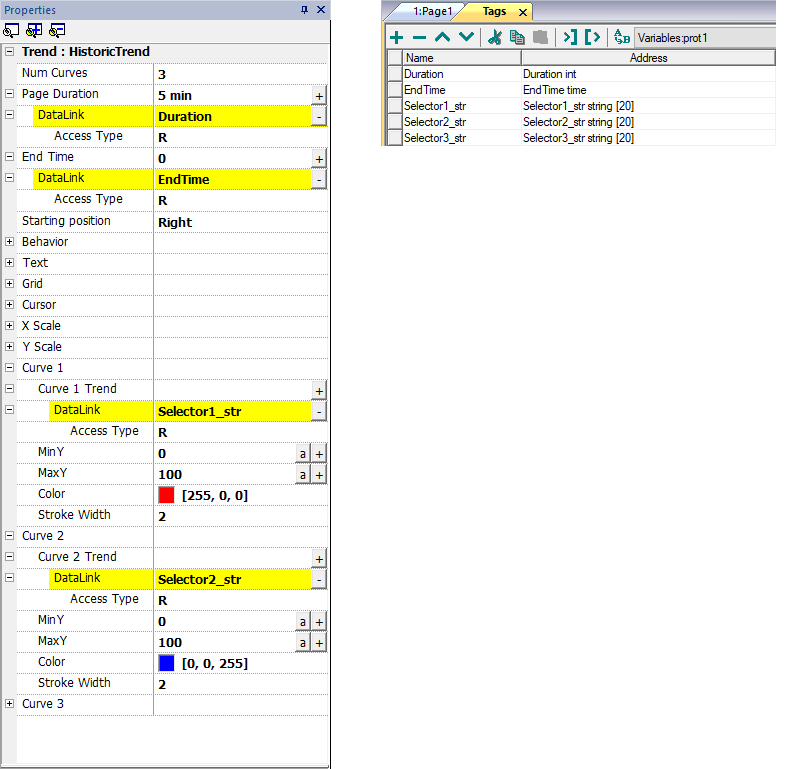
Modify trend widget properties at runtime
Using the attach to tag feature is possible to use tags to modifies some properties of the trend widgets at runtime.
Example 1
Using :
- Page Duration
- End Time
- Curve Name
is possible to modify from the runtime application the zoom factor, the window period and the curve to draw.
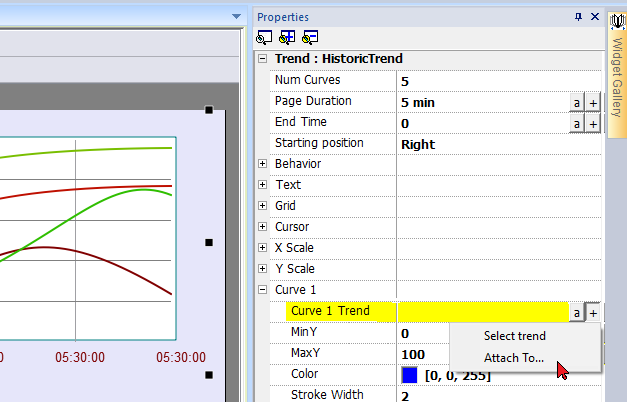
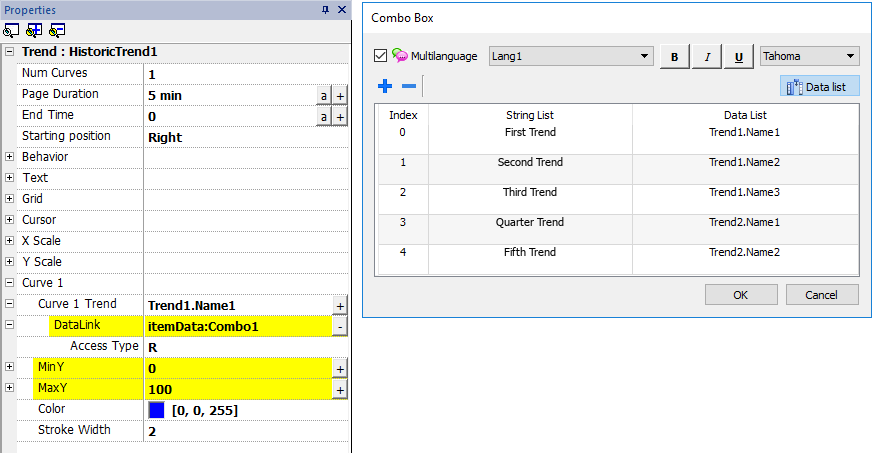
Example 2
Curve property can be attached to a Combo Box to select the curve to draw
Trend widget gestures
Trend widgets support gesture commands:
| Gesture | Description |
|---|---|
| pan | Touch the widget to scroll the curve within the widget area |
| pinch | Use two fingers to pinch the curve and perform zoom operations |
WARNING: Only multi touch HMI devices can generate pinch events
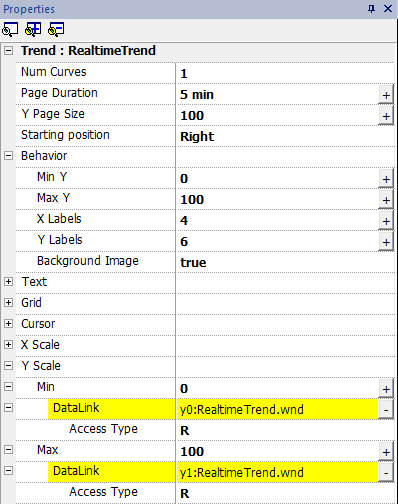
Note: In order to support gestures on Y axis, Min/Max properties of the trend widget must be linked to Min/Max values of Behavior parameters (default for new trends).
Request Samples
Request Sample property can be set for each curve and indicates the maximum numbers of samples read by the widget at one time from the trend buffer.
Tip: You normally do not need to modify the default value. Adjust it to fine tune performances in the trend widget refresh, especially when working with remote clients.
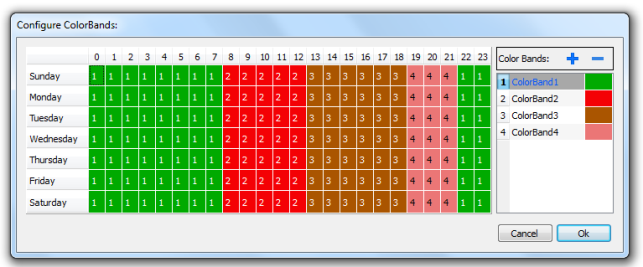
Color bands
Use the color bands configuration to customize your graphs background, for example to make certain days or hours stand out (weekends, night hours, etc.).
- In the Properties pane, in Color Bands property click +: the Configure Bands window appears.
- Click + to add as many colors you need.
- Select multiple cells and click on a color band to assign the color to the selected range of cells.
Note: This feature only uses local time in the trend widget, not the global time option.
Calendar color bands example
